Building the Python chow_test Package
In my spare time I like to do online courses. Some of them are free, like the ones on Coursera and edX, and some of them I pick up on sale, like the ones at Udemy, to build up my skills in my spare time. Although my education at the the University of Waterloo is great, my mind is always looking to learn more which is why I’ve turned to the plethora of programming/data science MOOCs.
For the past few weeks I’ve been working through the University of Rotterdam’s Erasmus School of Economics’ Econometrics: Methods and Applications course. It’s been a lot of fun so far (just two more weeks to finish) and has got my data science mind flowing with ideas. One of these was the chow_test package.
Idea
One section of the course went over the idea of model specification. In other words, how do we know the models we are building are valid and useful? In this module we went over a bunch of different tests used in the econometrics field to do this, including the Ramsey RESET test, and the Chow break and forecast tests.
The course also issues training exercises, which I’ve been completing in Python. Most of the course has been relatively easy to implement using either sklearn or statsmodels (as I’m pretty familiar with implementing both), but after completing the model evaluation module I realized there wasn’t a Chow break test implemented in Python.
Now the test is relatively simple to build from scratch, which I did when first completing the assignment, but would be tedious if you needed to do it often. When I was looking around online there were already implementations in both SAS and the R programming language. Granted, many economists prefer to use these two languages instead of Python in my experience, so this wasn’t totally unexpected. But I knew future econometricians using Python would want something easy to use like I did, so I built it.
So What is the Chow Break Test?
The Chow break test was developed by econometrician Gregory Chow in 1960 to test for structural breaks within a dataset. It uses different residual sum of squares to calculate whether or not your data is best represented with one linear model or multiple linear models broken up with breaks in time.
Economic data can often have significant or violent break points that make a single linear regression line from being unfit to represent the data best. For examples of this kind of data Statistics How To outlined some:
- Donations given to an organization before and after a natural disaster.
- Stock market prices before and after Black Friday.
And more. For this reason, sometimes data can be better modeled with two or more regression lines. If there is a known break point, the Chow break tests measures this by using this formula: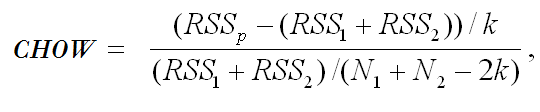
Where:
- RSSp is the residual sum of squares for the linear regression without breaks.
- RSS1 and RSS2 equals the residual sum of squares for the linear regression lines represented by the data before and after the break point.
- k represents the number of breakpoints
- N1 and N2 equals the number of data points in SS1 and RSS2
- CHOW is an F-value that is compared to the rejection region (the F-critical value) as a hypothesis test
The Project
The repository for the module is here.
I had never built a Python module or package before so I followed this tutorial and some others loosely. You can install it by following these instructions:
1 | git clone https://github.com/jtloong/chow-test.git |
And in the code where you’re using it just import like so:
1 | import chow_test |
It was relatively easy to build. It has three dependencies: pandas, numpy and sklearn. Pandas is for handling the data, numpy to perform quick functions across the data, and sklearn to perform the linear regressions. The current version only works with simple linear models with a single x-variable, that have a time-axis in years as integers, and when finding breaks where k = 2.
The function itself has five parameters:
1 | chow_test.calculate(Year, data, timeColumn, x_column, y_column) |
Where the parameter requirements are:
| Parameter | Requirement |
|---|---|
| Year | A valid year as an int |
| data | A pandas dataframe of your data |
| timeColumn | A string of the name of your time column |
| x_column | A string of x-variable column name |
| y_column | A string of y-variable column name |
When called, the data is handled like so:
1 | rss_total = find_rss(data, x_column, y_column) |
The calculate function then has a subfunction called find_rss, which outputs the residual sum of squares for each regression line t like so:
1 | def find_rss (data, x_column, y_column): |
Given these residual sum of square values we can then use the Chow test formula to compute the f-value:
1 | chow_nom = (rss_total - (rss_1 + rss_2)) / 2 |
With all this handled in the background and packaged up like this, you can then import and use it in your code!
Future & Conclusion
Right now I would definitely say the module is in the alpha stage. Although it works with this specific use case, I’d like to expand it to be able to handle more time series break points, as well as models with more than one x-variable. This would be great functionality that I think a lot of economists would be interested in using.
This mini project really opened my mind to the lack of econometric tools available in the Python ecosystem. Although Python is great for deep learning and some other machine learning tools, I feel like there has been a considerable lack of development in more traditional statistical tools. I hope that I can improve on this module and hopefully implement more stuff to add to the vibrant Python data science ecosystem.
Comments powered by Talkyard.